
CAC, LTV, and Break-Even: The 3 Numbers Every Founder Should See Weekly
Customer acquisition cost, lifetime value, and break-even, the three unit-economics numbers that decide whether a service business scales or stalls.

TL;DR
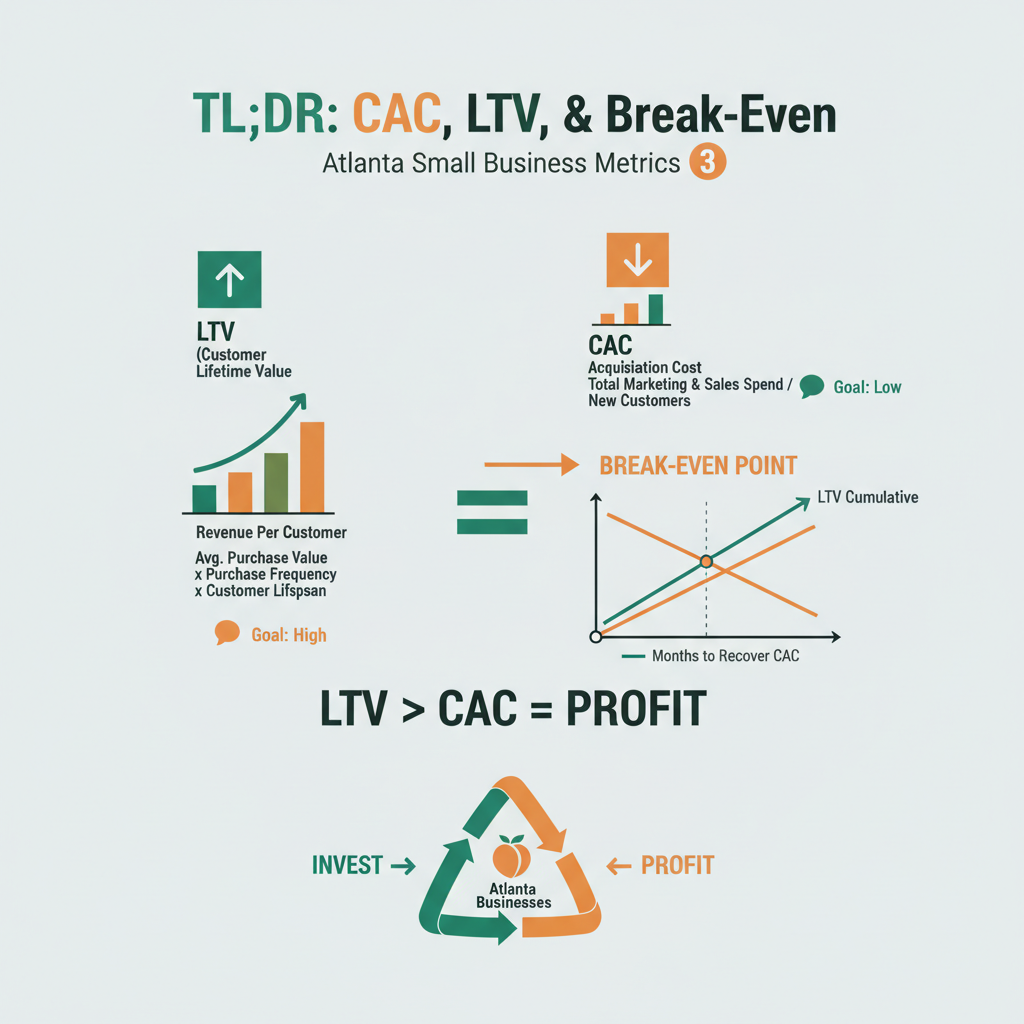
Three numbers decide whether a service business scales: customer acquisition cost (CAC), lifetime value (LTV), and break-even point. Most founders know top-line revenue. Almost none know these three. Cause & Effect builds a living financial model for every partner that tracks all three weekly, because these are the levers that actually move the business.
What is CAC and why does it matter?
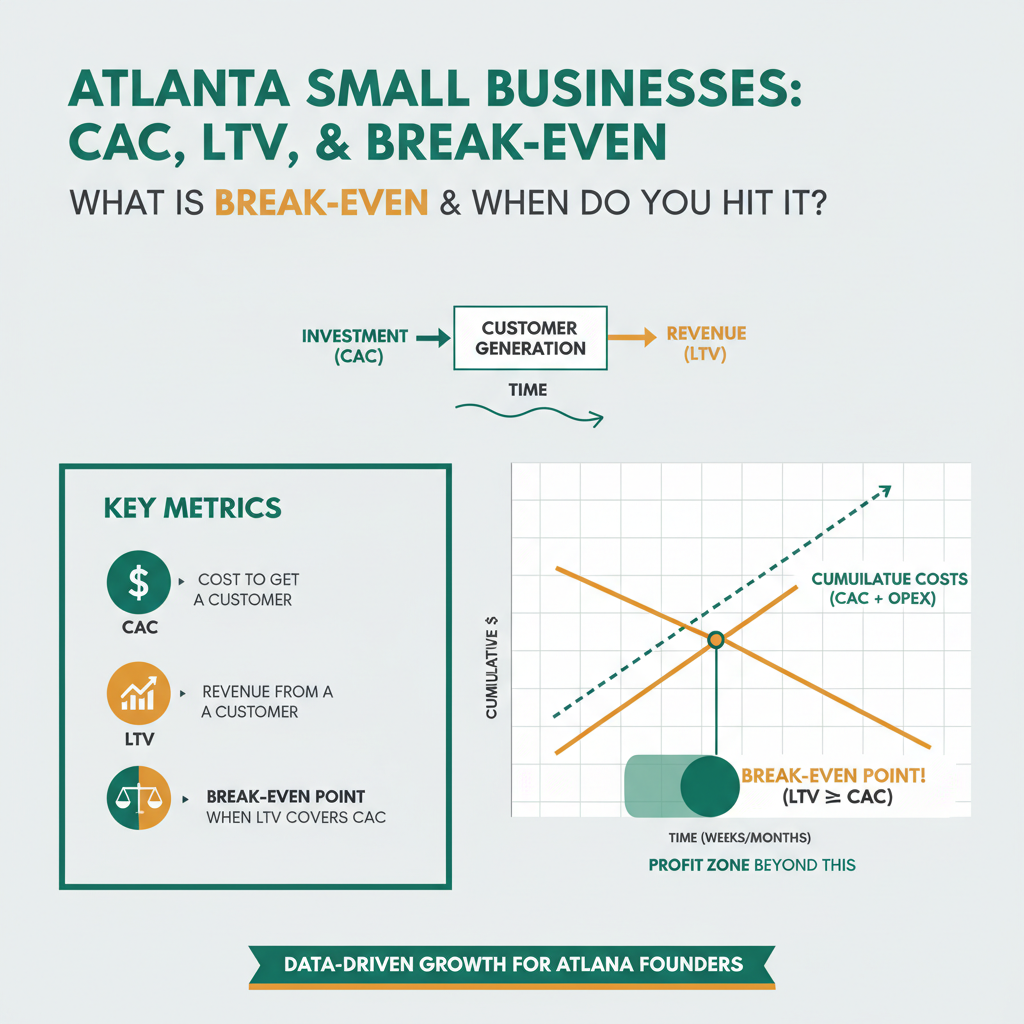
Customer acquisition cost is the total amount spent acquiring one new customer, marketing, ads, content, sales time, tools, and any referral or commission costs, divided by the number of new customers gained.
The formula is straightforward: CAC = (total sales and marketing cost in period) ÷ (new customers in period). If a partner spends $2,000 on ads and content and lands 8 new customers, CAC is $250. Simple. The catch is that most founders leave out half the inputs. They count ad spend but forget sales time, software costs, referral commissions, and the content production labor that fed the funnel.
HubSpot’s CAC benchmark research shows that service businesses typically land between $150 and $800 CAC depending on vertical, with professional services (legal, accounting, consulting) on the higher end and home services on the lower end. If your CAC is outside that band, something is either very right or very wrong, and you need to know which.
CAC matters because it’s the denominator under every growth decision. If you’re trying to decide whether a $400 ad campaign is worth running, the answer depends on your CAC relative to LTV. Without both, you’re guessing. With both, the decision is arithmetic.
What is LTV and how do you calculate it?
Customer lifetime value is the total gross margin a customer generates over the full relationship with the business, from first purchase to churn.
The simplest LTV formula for a service business: LTV = (average order value) × (number of purchases per year) × (average customer lifespan in years) × (gross margin percentage). A partner averaging $800 per project, 3 projects per year, 2-year customer lifespan, and 70% gross margin has an LTV of $800 × 3 × 2 × 0.7 = $3,360.
Now pair it with CAC. If CAC is $250 and LTV is $3,360, the LTV:CAC ratio is 13.4. ProfitWell’s unit economics research considers anything above 3.0 healthy and anything above 5.0 excellent. Below 1.0 means you’re losing money on every new customer, which, counterintuitively, is where many growing service businesses actually sit without realizing it.
LTV is where retention compounds. Bain & Company’s classic loyalty research found that a 5% increase in retention rates increases profits by 25–95% depending on industry. That’s because retained customers buy more, refer more, and cost less to serve. Improving LTV is usually cheaper than reducing CAC, and it compounds for years.
What is break-even and when do you hit it?
Break-even is the monthly revenue point at which total revenue covers total fixed costs plus variable costs, the moment the business stops losing money and starts making it.
The formula: Break-even revenue = fixed costs ÷ contribution margin percentage. A partner with $3,000 in monthly fixed costs (software, subscriptions, one part-time contractor) and a 60% contribution margin needs $3,000 ÷ 0.60 = $5,000 in monthly revenue to break even. Below that, they’re burning cash. Above that, every additional dollar contributes to profit.
The number to track is not just “are we there yet”, it’s “how much margin above break-even do we have.” A business running $5,500 on a $5,000 break-even has $500 of cushion. A pricing change, a lost customer, or a surprise expense wipes that out. A business running $8,000 on the same break-even has room to breathe and room to invest. That’s the distinction between surviving and scaling.
According to SCORE’s small business cash flow research, 82% of small business failures trace to cash flow issues rather than profitability issues, and the single biggest cash flow mistake is not knowing the monthly break-even number. Founders make pricing, hiring, and spending decisions without the one metric that would tell them whether those decisions are affordable.
Why should founders see these numbers weekly, not monthly?
Monthly is too slow. By the time a founder sees a bad CAC trend in a monthly P&L, they’ve already spent four weeks scaling a broken funnel.
Weekly cadence lets the founder catch trend changes inside one or two data points instead of waiting a full month. CAC creeping from $250 to $340 over three weeks is a signal to investigate immediately, maybe the ad platform algorithm shifted, maybe a channel saturated, maybe sales response time slipped. Waiting for the monthly review means another four weeks of drift before the fix lands.
The weekly ritual doesn’t need to be complicated. Five minutes on Monday morning: three numbers, three trend lines, one decision. Is CAC stable or rising? Is LTV projection holding? Are we above or below break-even? If all three are green, execute the plan. If any are red, pause and diagnose before scaling further.
Cause & Effect builds this into every partner engagement. The finance side of the team, led by Devon, builds a live financial model [pctx_012] and updates it weekly with actual numbers from the CRM, ad platforms, and bookkeeping. Partners see the model in their dashboard alongside revenue and operational metrics. Three numbers, every week, without fail.
What’s the fastest way to improve each number?
Each of the three numbers responds to different levers. Knowing which lever matches which number is half the battle.
| Number | Biggest Lever | Time to Impact |
|---|---|---|
| CAC | Close rate improvement | 2–4 weeks |
| LTV | Retention + upsell | 30–90 days |
| Break-even | Fixed cost audit | 1–2 weeks |
To lower CAC fast: fix the close rate. Faster sales response time, tighter qualification, clearer pricing, better objection handling. Moving close rate from 15% to 22% on the same lead volume cuts CAC by a third without touching ad spend. To raise LTV: build retention. Better onboarding, quarterly check-ins, a referral program, and explicit upsell conversations at the right moment. To move break-even: audit fixed costs quarterly. Most service businesses carry 15–25% in software subscriptions they don’t use, contractors they don’t need, and overhead that drifted in without a decision.
The three levers compound. Lowering CAC, raising LTV, and reducing break-even simultaneously changes the business math faster than any single marketing push can.
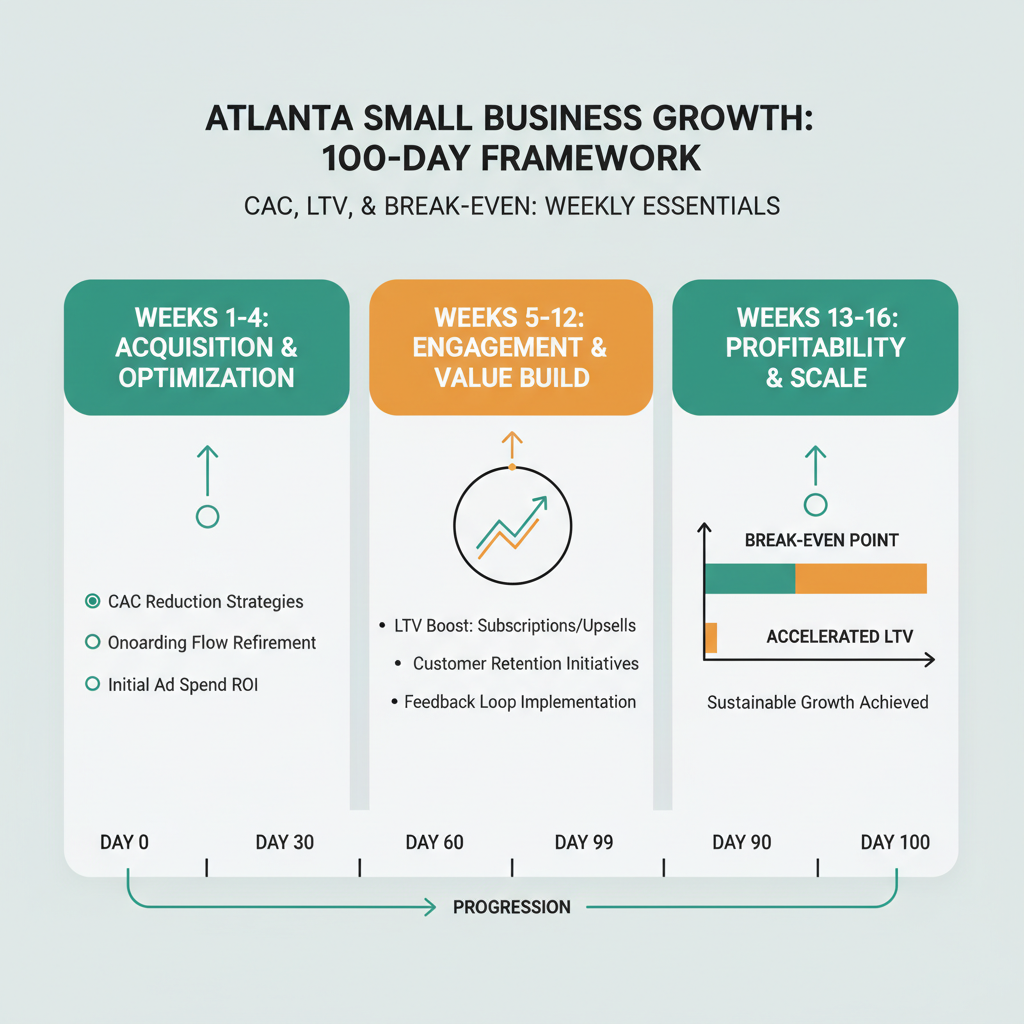
How does this tie into the 100-day framework?
The three numbers are the core deliverable of Phase 2 (days 31–60) in the 100-Day Growth Partnership. Phase 1 proves the machine works. Phase 2 makes the math visible.
By day 60, every partner has a live financial model showing CAC, LTV, break-even, and a 12-month revenue projection. The model isn’t a spreadsheet handed over at a meeting, it’s a living document updated weekly from real CRM and ad data. This is one of the three disciplines Cause & Effect combines under a single engagement [pctx_017]: digital infrastructure, financial modeling, and operations optimization. Most agencies touch one. We bundle all three because they only work together.
Phase 3 then uses the financial model to run scenario analysis. What happens if we raise prices 15%? What happens if we add a second service line? What happens if we hire a first employee at month 6? You can’t answer any of those questions without CAC, LTV, and break-even. With them, the answers become arithmetic.
What does the Atlanta version of this look like?
For Atlanta service businesses, the CAC math bends hard around local search and local reputation. Google Business Profile rankings, local citations, and word-of-mouth referrals often produce CAC 40–60% lower than cold paid channels.
We’ve seen Atlanta legal, trade, and home services partners running CAC in the $80–$180 range on local search traffic alone, versus $400–$800 on cold Google Ads. The implication is tactical: if you’re an Atlanta service business, investing in local SEO and citation building before scaling paid ads is often the highest-ROI sequence. Local first, paid second.
The LTV math also compounds differently locally. Service businesses with strong reputations in specific Atlanta submarkets, Decatur, Sandy Springs, Roswell, get higher referral rates and better retention, both of which push LTV up without pushing CAC up.
How do I start tracking these without a finance team?
Start with a simple weekly dashboard, CRM data, ad platform data, and bookkeeping data, and three formulas. No enterprise software required.
The minimum viable setup: a Google Sheet with weekly columns for new customers, sales and marketing spend, average order value, recurring customers, and monthly fixed costs. Plug the three formulas: CAC = spend ÷ new customers. LTV = AOV × purchase frequency × lifespan × margin. Break-even = fixed costs ÷ contribution margin. Update every Monday. That’s it. You can always upgrade to better tooling later, but the discipline matters more than the software.
If you want the model built for you as part of a partnership engagement, the 100-Day Growth Partnership includes live financial modeling from day 31 onward. Devon, our finance co-founder, builds it from scratch for every partner [pctx_012].
FAQ
Should CAC include all marketing costs or only paid ads?
All marketing costs. CAC should include ad spend, content production, marketing software, sales time valued at an hourly rate, and any referral commissions. Leaving anything out gives you an artificially low number that hides the real unit economics.
What’s a healthy LTV:CAC ratio for a service business?
3:1 is the commonly cited healthy floor. Above 5:1 is excellent. Below 1:1 means you’re losing money on every new customer and growing broke. Most small service businesses sit between 2:1 and 4:1 without realizing it, and don’t know how to improve either number.
How often should I update LTV assumptions?
Quarterly at minimum. LTV depends on retention, average order value, and purchase frequency, all of which drift over time. A stale LTV assumption from a year ago will mislead every pricing and marketing decision you make today.
What if my business is too new to have real LTV data?
Use industry benchmarks as a starting estimate, then replace them with real data as fast as possible. Your own data beats any benchmark. For the first 90 days, track actual customer behavior obsessively, purchase frequency, service additions, churn signals, and update assumptions weekly.
Is break-even the same as profitability?
No. Break-even is the revenue level at which costs are covered. Profitability is what happens above break-even. A business at break-even is not losing money, but it’s not making any either. The goal is to run as far above break-even as possible without inflating fixed costs.
Do I need accounting software to track these?
No. A Google Sheet with five inputs and three formulas is enough to start. Upgrade to QuickBooks, Xero, or a bookkeeper when the manual updates become painful. Tool sophistication should follow business complexity, not precede it.
How does this differ from tracking revenue?
Revenue is one number. CAC, LTV, and break-even are three different numbers that explain the shape of that revenue. A business doing $20K per month with $22K in costs is dying. A business doing $12K per month with $8K in costs is healthy. Revenue alone can’t tell the difference.
Can Cause & Effect help me build the financial model?
Yes. The 100-Day Growth Partnership includes a full financial model built by Devon in Phase 2 (days 31–60). It’s a live model, not a static spreadsheet, and it gets updated weekly from real CRM and ad data.
Get in Touch
If you’re running a small service business without clear visibility into these three numbers, you’re making decisions in the dark. Book a qualification call and we’ll walk through your current numbers, identify gaps in the model, and tell you whether a partnership or commercialized financial modeling is the better fit.
Christopher Drake Griffith is the co-founder of Cause & Effect Strategic Partners. Georgia Tech ISYE, supply chain focus. Based in Atlanta. LinkedIn.
Last updated: 2026-04-15