
How Do Interactive Website Design Elements Increase Conversions?
Static websites work. But active ones work better. When a visitor can touch, rotate, explore, and control what they see, something shifts. Attention deepens. Co
Static websites work. But active ones work better. When a visitor can touch, rotate, explore, and control what they see, something shifts. Attention deepens. Confidence builds. The path to “yes” becomes clearer.
This isn’t theoretical. The data on interactive design’s impact is consistent. We’ll look at what counts as interactive, which elements move the needle most, and how to measure whether your interactive design is actually working.
What Counts as Interactive Website Design?
Answer Capsule: Interactive design means the visitor controls the experience—from micro-interactions like hover effects to complex 3D exploration and product configurators.
Interactive design means the visitor controls the experience. It’s a spectrum, not a single thing.
On one end: hover effects. A button changes color. A menu expands. These are micro-interactions. Small but they signal responsiveness. The site feels alive instead of static.
Moving further: scrollytelling. Content reveals as you scroll. Parallax effects where background moves at a different speed than foreground. These guide attention and create narrative pacing.
Then: functional interaction. A product configurator where you change colors and see the result. A calculator where you input values and get immediate feedback. These solve real problems.
At the complex end: 3D exploration. Rotate a product. Walk through a space. Interact with data visualization. These require more resources but create deeper engagement.
Somewhere in between: form interactions. Fields that validate as you type. Progress bars showing where you are in a multi-step process. Dropdown menus that show relevant options. These reduce friction.
The pattern: interaction works when it’s purposeful. When it helps the visitor understand your product better or move toward conversion faster. Interaction for its own sake creates the opposite effect.
How Do Interactive Elements Affect Conversion Rates?
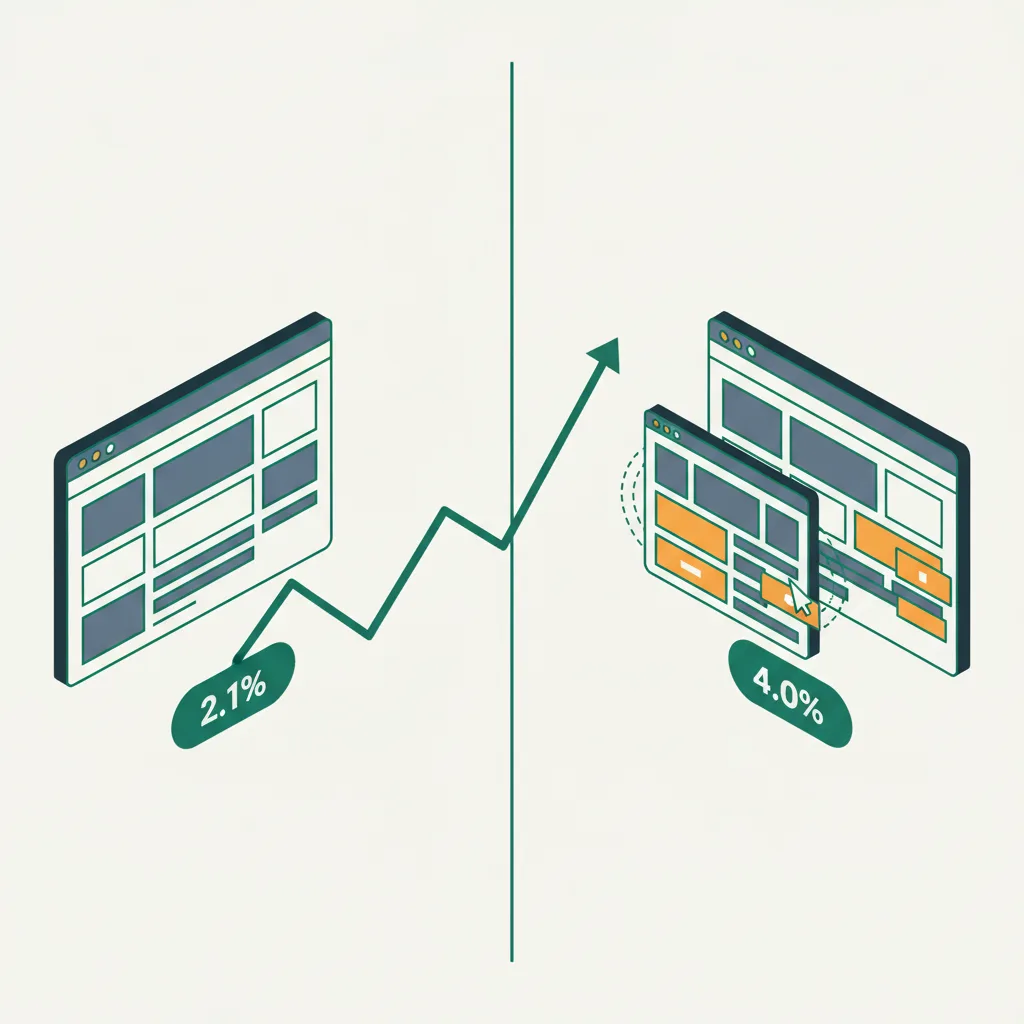
Answer Capsule: Interactive 3D content on product pages increases conversions by 94%. Interactive features boost user retention by 60% and typically reduce bounce rates by 20-30%.
The data is strong. Interactive 3D content on product pages increases conversions by 94%. That’s specific to 3D, but the pattern holds for interactive elements broadly.
The mechanics work like this: a visitor lands on your page. They have questions about your product. Interactive elements let them answer those questions themselves. That’s different from you telling them the answer.
Telling: “This chair comes in leather and fabric.” Showing: a visitor configures the chair, sees leather, switches to fabric, understands the visual difference in real-time. The second converts better.
The reason is control. Humans remember more from experiences they control versus passive observation. An interactive exploration feels like discovery. It’s more memorable. The product feels more real.
Interactive features boost user retention by 60%. Visitors stay longer. More time on site signals higher intent. Longer engagement creates more conversion opportunities.
Time-on-site matters because conversion is often not instant. A visitor lands. They explore. They might leave. They think about it. They come back. Longer initial sessions and multiple returns indicate growing confidence.
Bounce rate typically improves. Visitors who interact are less likely to leave immediately. They’re invested in the experience. A high-interaction site often sees bounce rates 20-30% lower than comparable static alternatives.
Return visitor rate increases. People want to experience again. “Did I see everything?” motivates return visits. That persistence matters.
Which Interactive Features Drive the Most Engagement?
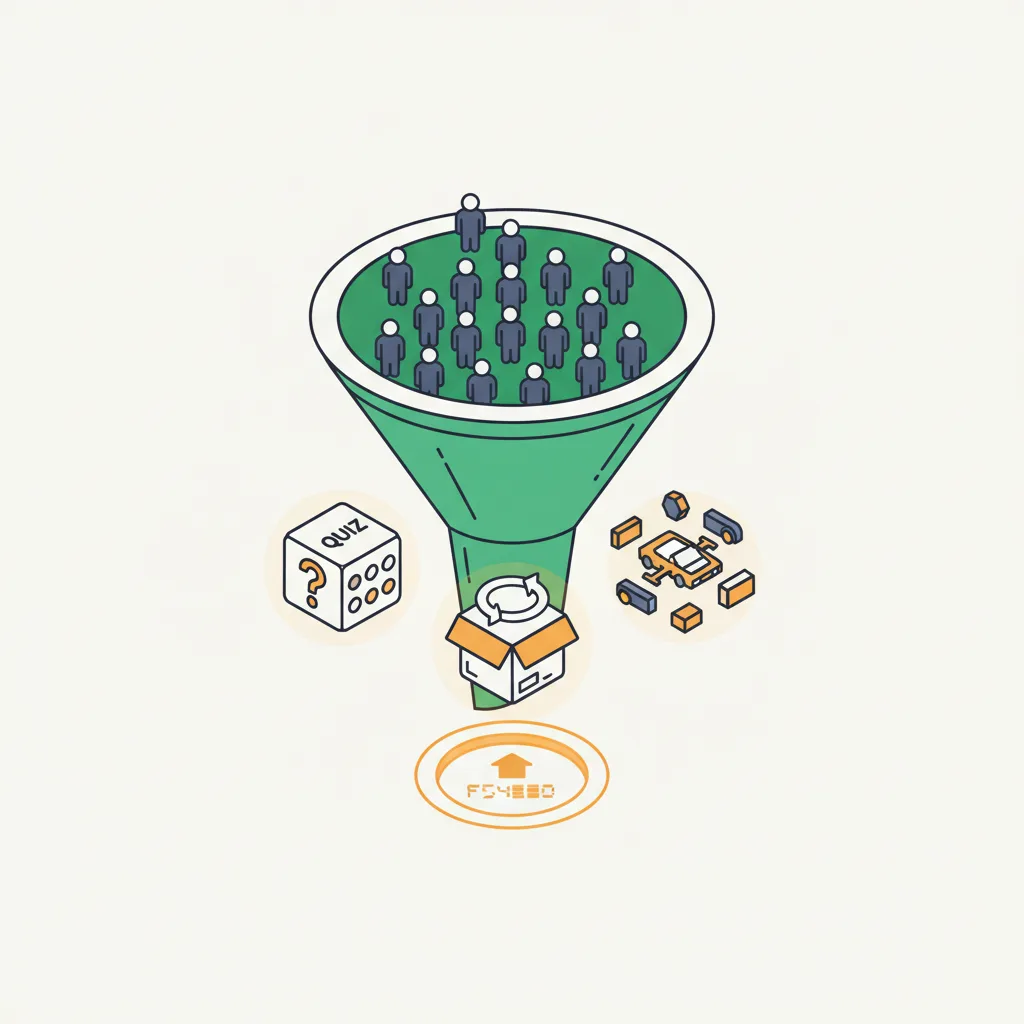
Answer Capsule: Product configurators top the list, followed by 3D product viewers (82% interaction rate), before-and-after sliders, interactive infographics, and quizzes.
Product configurators top the list. Apparel brands where visitors customize colors and patterns. Furniture where buyers see items in different materials. Car builders where you add options and watch price update. These directly impact buying confidence.
82% of visitors interact with 3D assets on pages where they’re present. That’s extraordinary. Eight out of ten people choose to engage. Compare that to video, which requires an active decision to play. Most people just scroll past.
3D product viewers come next. The difference between a static photo and a model you can rotate is vast. Visitors zoom in on details. They examine stitching, materials, construction. They understand what they’re buying.
Before-and-after sliders. Popular in home services, personal training, photography. You drag the slider. Reality reveals. The transformation becomes visceral. Marketing becomes undeniable.
Interactive infographics and data visualizations. Your visitor controls what they see. They hover over data points and get context. They drill down into what interests them most. Engagement soars.
Scroll-triggered animations. As someone reads, content animates into view. It’s not 3D but it’s responsive. It feels like the page is paying attention. The pacing controls attention flow.
Interactive quizzes and assessments. Visitors answer questions and get personalized results. The interactivity feels like the site understands them. Results are more meaningful than generic content.
Comparison tools. “This plan versus that plan.” Your visitor controls the comparison. Seeing differences they care about beats you telling them what matters.
Form interactions with instant feedback. Validation in real-time. Field-by-field guidance. Progress visibility. These reduce anxiety. Visitors complete forms instead of abandoning them.
What’s the ROI of Interactive Website Design?
Answer Capsule: Measurable benefits include 94% conversion lift, 40% reduction in product returns, lower support volume, higher average order value, and improved brand perception.
Measurable benefits include conversion rate increase. A 94% lift on product pages is significant. Even if it’s only a 20% lift in your specific case, that’s substantial return.
Reduced returns matter tremendously. 3D content reduces product returns by 40%. Every return is cost: logistics, refurbishment, lost profit. A 40% reduction compounds quickly.
Lower customer support volume. When visitors can explore your product interactively, they answer their own questions. Fewer support emails. Fewer chat messages. Reduced support cost.
Longer average session duration. More pages visited per session. More conversion opportunities per visitor.
Higher average order value. Configurators often increase AOV. The visitor customizes extensively. What started as a base product becomes something they’ve invested time designing. They’re willing to pay more.
Improved brand perception. Interactive sites feel modern. They feel professional. They feel like the company invested in user experience. That builds trust.
Competitive advantage. If your competitor has a static website and you have interactive features, visitors notice. The difference is obvious.
Data for optimization. Interactive elements generate behavioral data. Where do visitors click most? Which configurations sell best? What sequences lead to conversion? This information guides future decisions.
How Do You Measure the Impact of Interactive Design?
Start with baseline metrics before launching interactive elements. Conversion rate. Average order value. Bounce rate. Time-on-site. Pages per session. Return visitor rate. These become your control.
After launching interactive features, track the same metrics. Did conversion rate change? By how much? Did time-on-site increase? Did bounce rate decrease? These tell the story.
Segment the data. Compare visitors who used the interactive feature to those who didn’t. Did the interactive users convert more? That’s proof of impact.
Track feature-specific engagement. How many visitors interact with your 3D viewer? Of those, what percentage convert? How does that compare to visitors who didn’t interact? This shows correlation.
Use heat mapping and session recording tools. Where do visitors click? Do they find the interactive feature? Do they understand it? Do they get stuck? The qualitative data reveals what numbers don’t.
Test different implementations. Try interactive element A versus interactive element B. Measure which performs better. Iterate based on data.
Set up goal tracking. Every meaningful conversion should be tracked. Not just purchase. Sign-up, demo request, application, subscription. Interactive design helps across the funnel.
Compare against industry benchmarks. Your bounce rate improving by 5% means something. What does it mean relative to your industry average? Competitive sites might use this as baseline.
Attribution becomes complex. An interactive element might not directly convert. It might increase engagement that leads to a future conversion. Long-form attribution tracking helps tell this story.
The Conversion Psychology Behind Interaction
Control matters psychologically. When you make choices, you’re invested. Your brain treats it differently than when someone makes choices for you. Interactive sites let visitors take control.
Ownership feeling grows from exploration. A visitor who’s spent 10 minutes exploring your 3D product configurator feels like they’ve already partly made the purchase decision. The emotional investment is higher.
Questions answered immediately reduce friction. Instead of emailing support, the visitor spins the product and sees the answer. Friction drops. Conversion speed increases.
Confidence builds from direct experience. Reading specs is passive. Building the product yourself and seeing the result is active. Confidence from active experience is stickier.
Memory improves. Experiences are more memorable than information. An interactive session sticks with visitors longer. They tell others about it. They return to it.
Learn more about how Cause & Effect builds 3D-interactive design experiences that convert. We measure results and iterate based on data.
FAQs
What’s the simplest interactive element I can add to my website?
Hover effects and micro-interactions are the simplest starting point. A button that changes color, a card that slightly lifts on hover, or a menu that smoothly expands. These signal responsiveness and make your site feel alive without requiring significant development effort.
How much does interactive website design cost compared to static design?
Basic interactive elements (hover effects, scroll animations) add 10-20% to standard design costs. Product configurators and 3D viewers add $5,000-$25,000 depending on complexity. The ROI typically justifies the investment—94% conversion increase on product pages more than covers the additional cost.
Do interactive elements slow down my website?
Not when properly implemented. Well-optimized interactive elements using modern frameworks like Three.js actually leverage your device’s GPU, which can perform better than heavy CSS animations. The key is optimization—lazy loading, compressed assets, and progressive enhancement for different devices.
Which industries see the biggest conversion lift from interactive design?
E-commerce and product-based businesses see the strongest results—94% conversion increase with 3D product pages. Real estate (31% faster sales with 3D tours), luxury goods, furniture, and automotive follow closely. Service businesses benefit from interactive quizzes, calculators, and before-and-after comparisons.
How do I know if interactive design is working on my website?
Track conversion rate, bounce rate, time-on-site, and pages per session before and after implementation. Segment data by visitors who used interactive features versus those who didn’t. Use heat mapping to see engagement patterns. A working interactive element shows higher conversion rates and longer engagement among users who interact with it.