ISYE Discipline In Small Business Ops: Throughput, Forecasting, Routing
How industrial and systems engineering tools, throughput analysis, demand forecasting, and routing, apply to small service businesses in Atlanta.

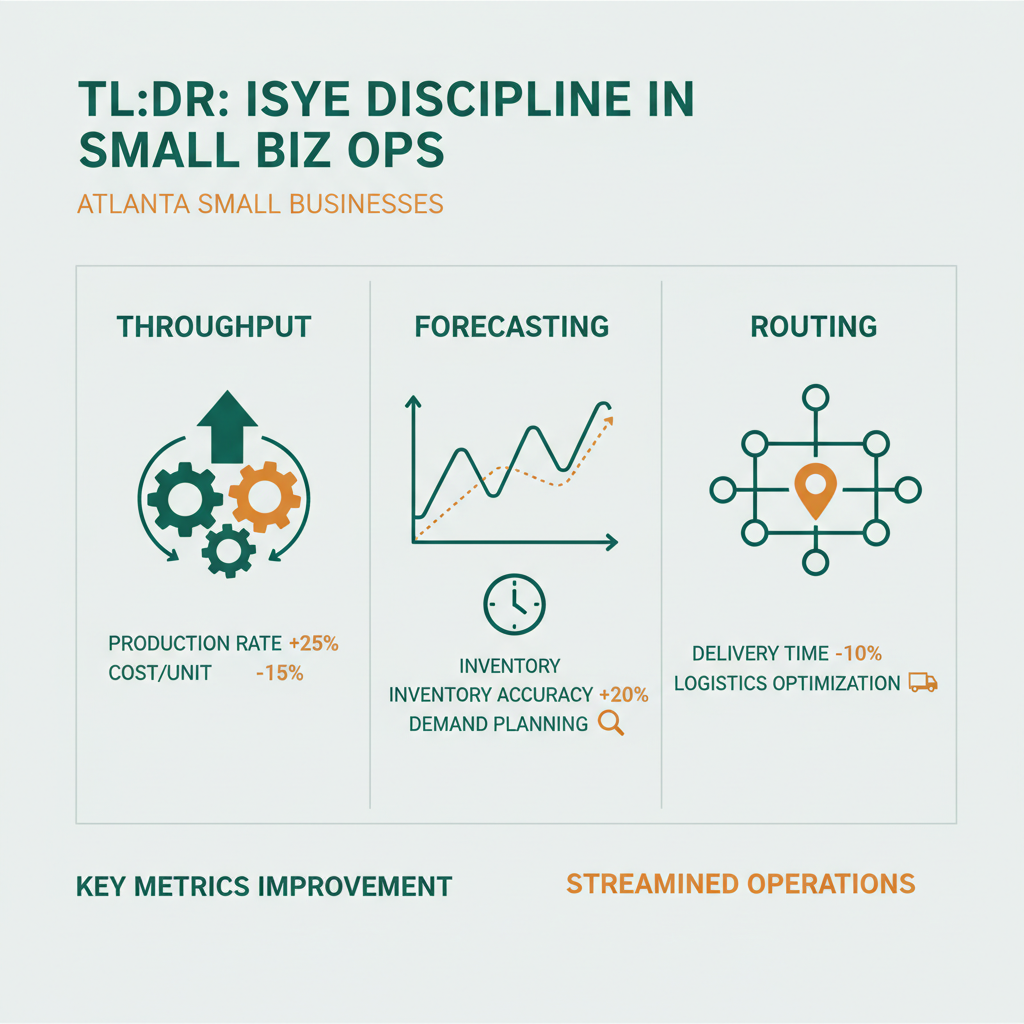
TL;DR
Industrial and systems engineering, the Georgia Tech ISYE discipline, is a toolkit built for factories, supply chains, and airlines. Pointed at a 5-person service business, it identifies throughput bottlenecks, forecasts demand more accurately than gut feel, and routes work through the operation efficiently. It’s the difference between a business that scales and one that stalls at the founder’s capacity.
What is ISYE and why does it matter for small businesses?
ISYE stands for industrial and systems engineering, the academic discipline that studies how to design, analyze, and optimize complex operational systems using math, simulation, and data.
The Georgia Tech H. Milton Stewart School of ISYE is consistently ranked the #1 industrial engineering program in the United States. Its core toolkit covers throughput analysis (how much work moves through a system per unit time), queueing theory (how waiting lines behave), demand forecasting (how to predict volume), routing optimization (how to move work through nodes efficiently), simulation (how to model operations before changing them), and statistical quality control (how to measure and reduce defect rates).
Most of that toolkit was developed for manufacturing and supply chains. It scales down to a 5-person service business more cleanly than you’d expect. A law firm is a system with arriving cases, processing stages, and output. A home services business is a routing problem. A content agency is a throughput question. The math doesn’t care whether you’re running a factory or a founder-led consulting practice, bottlenecks, queues, and forecasts behave the same way.
Cause & Effect’s operational work for partners [pctx_013] borrows directly from this toolkit. Not metaphorically, literally. Same equations, same analysis, pointed at smaller systems.
What is throughput analysis and how do you apply it?
Throughput is the rate at which work moves through a business from intake to delivery. Throughput analysis identifies the slowest stage in the process, the bottleneck, because improving anything except the bottleneck produces zero gain.
This is the core insight of Eli Goldratt’s Theory of Constraints: a system’s output is limited by its slowest link. A law firm that can accept 20 new cases per week but only onboard 12 has a throughput ceiling of 12. Adding more marketing, more lead flow, or more discovery calls doesn’t raise the ceiling. Only improving onboarding does.
The practical application: map the full customer journey as a series of stages (inquiry → qualification → proposal → close → onboarding → delivery → invoice → follow-up), measure the rate at each stage, and find the slowest one. That’s your bottleneck. Then focus 80% of improvement effort on the bottleneck until it’s no longer the slowest stage. When it moves, find the new bottleneck. Repeat.
Most founders instinctively try to improve the stages they’re best at, which are usually not the bottleneck. A founder good at sales keeps optimizing sales when the bottleneck is actually delivery capacity. Throughput analysis breaks that pattern by forcing attention to where the system is actually stuck.
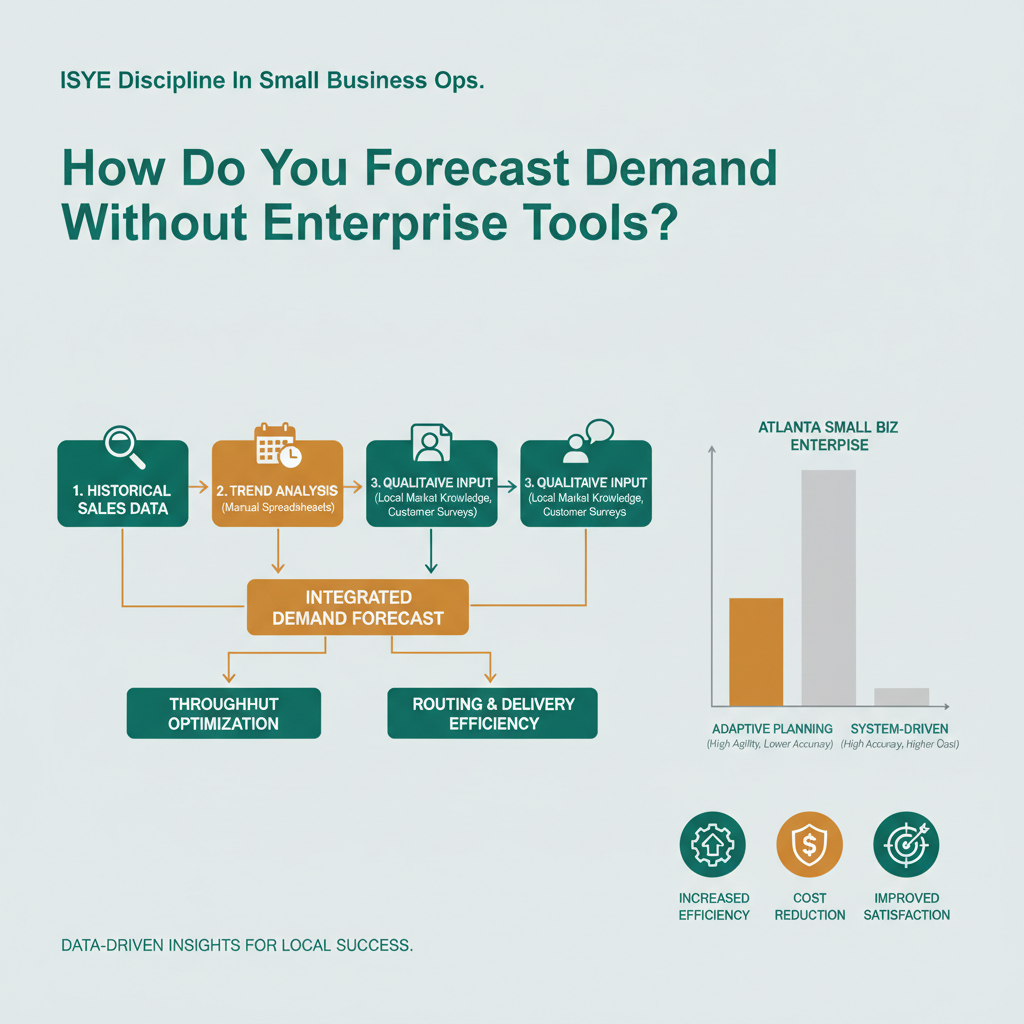
How do you forecast demand without enterprise tools?
Demand forecasting at the small business scale uses moving averages, seasonal decomposition, and simple regression, not enterprise forecasting software. The point is to replace gut feel with math that’s good enough to make decisions.
The minimum viable forecast uses three components. First, a trailing 12-week moving average of weekly leads or sales to establish a baseline. Second, a seasonality factor, which weeks, months, or quarters historically run above or below the baseline. Third, a trend line showing whether the baseline is rising, flat, or falling. Combine them, and you have a forecast that outperforms gut feel in the vast majority of small business contexts.
Why this matters: founders make hiring, inventory, and commitment decisions based on implicit forecasts. Those implicit forecasts are usually anchored to the most recent data point, last week was busy, so next week will be busy. Recency bias is a real problem in forecasting. Even a simple moving average reduces the noise enough to make capacity decisions meaningfully better.
MIT Sloan’s research on operations strategy shows that small businesses with formal forecasting (even simple models) outperform peers using intuition by 15–25% on capacity utilization. That’s a large margin for a tool that takes 30 minutes to set up in a spreadsheet.
What is routing and why does it apply to service businesses?
Routing is the optimization of how work moves through resources, which customer gets which team member, which day, in which order. For service businesses, routing problems show up in scheduling, load balancing, and geographic dispatch.
Home services businesses with multiple technicians face the most obvious routing problems: which tech goes to which job, in which order, to minimize drive time and maximize billable hours. A good route saves 15–30% on drive time versus a random assignment, which translates directly to more jobs per day per technician.
But routing also applies to non-physical service businesses. A law firm with three partners handling different case types routes incoming matters by specialization and current load. A consulting practice with four service lines routes new engagements based on team capacity and skill match. A creative agency with two designers routes projects based on style fit and queue depth. All three are routing problems with the same math.
The tools don’t need to be sophisticated. A weekly scheduling meeting that looks at pipeline, capacity, and assignment, guided by one or two simple rules, beats no routing discipline at all. The gain comes from being deliberate, not from being algorithmic.
How does simulation help before changing operations?
Simulation lets you model a proposed operational change on paper (or in a spreadsheet) before implementing it, so you can see the likely outcome without disrupting the real business.
The classic example: a service business considering whether to hire a second technician. The gut-feel answer is “if we have enough work.” The simulation answer models lead flow, conversion rate, average job size, current throughput ceiling, the new ceiling after hiring, the fixed cost of the hire, and the ramp time before the new tech is productive. The output is a weekly revenue and margin projection for 12 weeks under the current structure and 12 weeks under the new structure. The decision becomes arithmetic.
This doesn’t require engineering software. A spreadsheet with 15 rows and 10 columns can simulate most small-business decisions well enough to avoid expensive mistakes. The question “what happens to margin if we raise prices 15%” is a simulation question. So is “what happens to capacity if we add a virtual assistant” and “what happens to cash flow if the close rate drops 10%.”
We run these simulations for partners as part of Phase 3 scenario modeling in the 100-Day Growth Partnership. The point is not to predict the future exactly, the point is to make risky decisions less risky by front-loading the math.
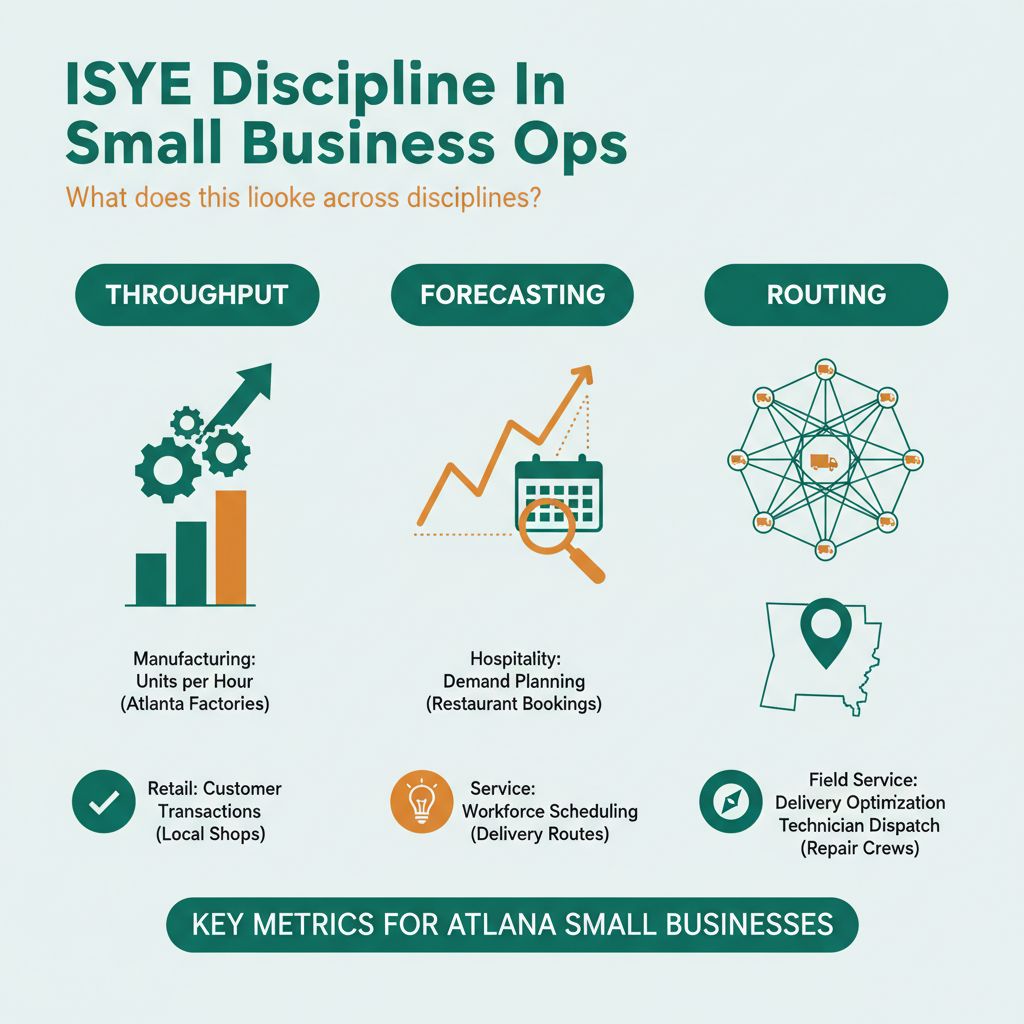
What does this look like across disciplines?
Cause & Effect combines three disciplines that agencies typically silo: digital infrastructure, financial modeling, and operations optimization [pctx_017]. ISYE is the operations leg.
| Discipline | Core Toolkit | Partner Deliverable |
|---|---|---|
| Digital infrastructure | Astro, Cloudflare, GSAP, SEO automation | Custom site, CRM, automated audits |
| Financial modeling | Unit economics, CAC/LTV, break-even | Live financial model, weekly review |
| Operations (ISYE) | Throughput, forecasting, routing, simulation | Bottleneck map, demand forecast, SOPs |
A service business that gets all three is operating with a toolkit normally reserved for firms 10x its size. That’s the intended outcome. We’re not trying to be a boutique agency or a boutique ops consultancy, we’re trying to bundle three specialist disciplines into one engagement where the profit-share math makes the bundle affordable.
How does Atlanta context affect this?
Atlanta’s service business density creates both routing and forecasting opportunities that smaller markets don’t. Enough volume to forecast meaningfully, enough density to route efficiently.
A home services business running across Sandy Springs, Roswell, Alpharetta, and Dunwoody has a clear routing problem, drive times between those submarkets matter. A legal practice running across Atlanta’s business districts has a forecasting problem, case volume by practice area varies with local economic cycles. A creative agency serving Atlanta’s healthcare and real estate sectors has a throughput problem, onboarding capacity is usually the bottleneck.
The ISYE toolkit lands especially hard in these contexts because there’s enough volume and enough complexity to make the math worth running. In markets too small to produce meaningful data, intuition sometimes keeps up with analysis. In Atlanta, it doesn’t.
How do you get started without an ISYE degree?
Start with throughput analysis. Map your customer journey as stages, measure the rate at each stage for four weeks, and find the bottleneck. That single exercise usually produces 2–3 immediate improvements and builds the mental habit of seeing operations as a system.
After that, layer in a simple weekly forecast (moving average + seasonality), then a weekly routing review (who’s doing what, at what capacity), then scenario simulation for any decision that affects capacity or cost. None of this requires a degree. It requires patience and the willingness to measure before acting.
The Association for Supply Chain Management (ASCM) publishes accessible introductions to most of these tools. They’re written for supply chain practitioners but translate cleanly to service businesses with minor adaptation.
FAQ
Do I need engineering software to apply ISYE thinking?
No. A spreadsheet handles most small business applications. The value is in the framework, identifying bottlenecks, forecasting with math, routing deliberately, simulating before changing, not in the software. Tool sophistication should follow business complexity.
What’s the single biggest operational gain for most small businesses?
Throughput analysis. Finding the bottleneck and focusing improvement effort there. Most founders spend energy on non-bottleneck stages because that’s where they’re comfortable working. A single clear bottleneck identification often unlocks 20–40% more output with the same resources.
How often should I re-run throughput analysis?
Quarterly at minimum. Bottlenecks move. When you fix one, a new one appears. The discipline is continuous identification, not one-time measurement.
What if my business is too new to have historical data for forecasting?
Use the data you have, even if it’s 4 weeks. A short moving average beats no forecast. As data accumulates, the forecast improves. Don’t wait for “enough” data, start with what exists and iterate.
Can you apply this to a business with no physical operations?
Yes. Knowledge work, creative services, and consulting all have throughput, queues, and routing problems. The stages are different (brief → draft → review → delivery instead of lead → estimate → dispatch → install), but the math is identical.
Does Cause & Effect apply ISYE to every partner?
Yes. Phase 3 of the 100-Day Growth Partnership includes operational analysis, throughput mapping, forecasting, and SOP development. The depth scales with the partner’s business complexity, but the discipline is always applied [pctx_013].
What’s the difference between ISYE and business consulting?
Business consulting tends to focus on strategy, positioning, and management. ISYE focuses on operational math, how systems actually move work from input to output. They’re complementary, but they’re different toolkits with different questions.
Do I need to learn the math myself or can someone run it for me?
Either works. We run the math for partners as part of the engagement. Founders who want to learn the tools themselves can start with Goldratt’s The Goal and work outward from there. Most founders find the habits more valuable than the equations.
Get in Touch
If your business is stalling and you can’t tell whether the problem is marketing, sales, or operations, book a qualification call. We’ll walk through the operational math, identify the most likely bottleneck, and tell you whether the partnership or a standalone operations review is the better fit.
Christopher Drake Griffith is the co-founder of Cause & Effect Strategic Partners. Georgia Tech ISYE, supply chain focus. Based in Atlanta. LinkedIn.
Last updated: 2026-04-15